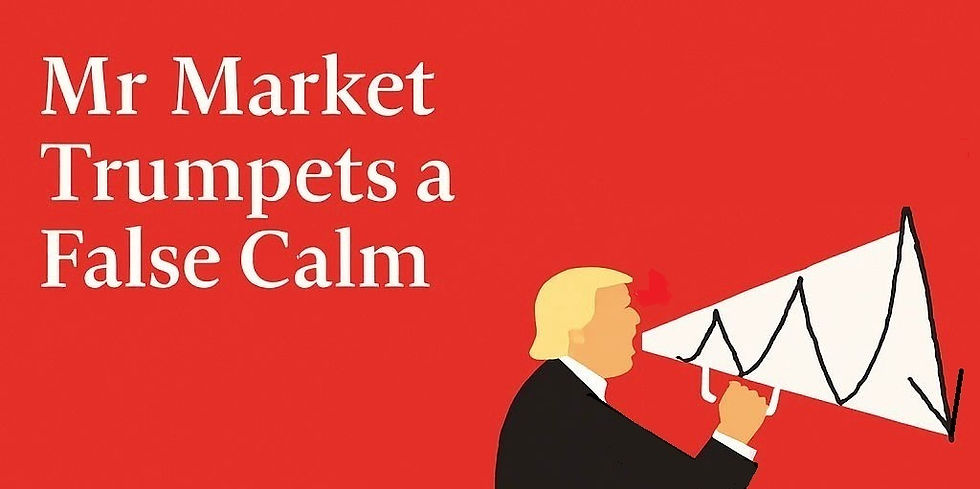
What may September & October bring? - Thomas Ng Memo 8 Sep 2023
- whatsyourtradingangle

- Sep 12, 2023
- 3 min read
Updated: Oct 8, 2023

So cuddly, not ready to maul yet.
On Monday 11 Sep 2023 12.24pm, I broadcast / emailed Clients my latest post titled 'What may September & October bring?'.
Below is the full transcript for your perusal:
'Dear Clients . It has been a while since we peek into the workings of Mr Market aka the S&P500 Index (SPX), so let's see how he is doing now! . What I mentioned on 27 Jun 2023: '..Thus if I could truly have it my way, I would like to see the current rally continuing or whipsawing into the late Aug - Sep months towards the said 78.6% retracement target level (ie SPX 4533) before seeing that sizable pullback we so often see in Sep and/or Oct of every year!..' Ref: https://tinyurl.com/consistencyisthename
.
The SPX unlocked my target 4533 on 18 July and then some. Since then, SPX has been whipsawing within a 200 point range from 4533. Now given Sep is infamous for being the worst month of the year for the US stock market due to annual negative seasonailty effects and PLUS the fact that we had such a sizable rally from April to July this year, I place the probability of a stronger price pullback or correction at about 70-80%. The remaining 20-30% probability caters to a continual rally towards, likely, all time highs (ATH).
.
So will we now get to witness that potential Sep-Oct horror as mentioned above, whatever reasons that may cause it? Could it be the mid Sep FOMC meeting where Powell may shock us with another 25bp hike in contrast with his signalling in the past month that there will be no hike in Sep? Or maybe it's another 'unknown unknown' waiting to break, much like Truss's affair with UK gilts last Sep? Honestly, I do not know but am sure eager to see!
.
Anyway news or narratives asiade, I will share with you below what I would like to see in my Bollinger Bands Strategy to trigger a more sizable pullback into Sep-Oct. I will also share where my pullback / correction targets may be.
.
.
Thomas's Bollinger Bands Strategy (BB Strategy): For those who have been following me for a while will know how I use the BB Strategy to watch out for a potential change in trend.
For the SPX pullback to start, I will need price action to return back to the lower segment of the Bollinger Bands 1st. Thereafter price action should get rejected at the BB midpoint line on every bounce.
Staying below the blue 50-day EMA will also put pressure down on price action (see Chart 1 below).
.
Currently the BB Strategy is still signalling a range trading or whipsawing environment (ie price action swings up & down between both upper & lower segments of the Bollinger Bands). Thus do watch out for price action to sink back into the Bollinger Bands lower segment, for a start.
.

Chart 1 - SPX Daily, 6-mth. Thomas's Bollinger Bands (BB) Strategy
Pullback targets:
My pullback targets are generally placed in line with the 38.2%, 50% and the 61.8% Fibonacci Retracement levels. See Chart 2 below.
. My bias in Sep-Oct is to see a retracement of SPX towards at least the 38.2% level at 4181+/-.
4181 coincides with the purple uptrend line since the Oct 2022 lows and 4181 is also close to the top of the Cup and Handle formation that triggered the current rally.
.
However, the 50% retracement is more likely the probable target as 4049 is the downside target of the Head & Shoulders Pattern should price action breaks below the 18 Aug low authoritatively at 4335.
.
I reckon there is no need to jump the gun yet to discuss about the 61.8% retracement since BB downside signal hasn't even been triggered yet.
.

Chart 2 - SPX Daily, 1-year. SPX potential mid-term pullback targets
On a side note, a pullback in the US mkts will likely see our local bourse (SGX) following thru as well. A very good zone to buy SG banks and big caps, etc, is when our Straits Times Index (STI) pull backs to the 3050 - 3100 zone.
.
So there you have it, I have stated clearly above what needs to trigger technically via Bollinger Bands Strategy (BB Strategy) to kickstart a pullback and what price levels to watch out for the potential pullback / correction. Queries welcome.
.
As usual, Live Long & Trade Well!
. Thank you & regards . Thomas Ng, CMT Principal Trading Representative
首席股票经纪 www.thom-ng.com . #plsreaddisclaimer #chartforillustrationonly #spx8sep23 #consistencyisthenameofthegame #showmethechart #tellyouthenews #befluid #wytant #livelongandtradewell
Chart source: tradingview
Image source: Unsplash'


Comments