My target 5110 and S&P500 all time high 5111 - what's next? - Thomas Ng memo 29 Feb 2024
- whatsyourtradingangle

- Mar 5, 2024
- 4 min read
Updated: Mar 7, 2024

Did you just say 'Bullseye!'
On Thurs 29 Feb 2024 10.40pm, I emailed Clients my latest post titled 'My target 5110 and S&P500 all time high 5111 - what's next?'.
Below is the full transcript for your perusal:
'Dear Clients
.
In an effort to enhance the efficiency of our communication and provide you with more timely updates, I've decided to transition to a shorter note format. Thus today i will talk only on the S&P500 Index (aka 'SPX') & save the analysis of the US Bond Mkt, Hk/China & SG market for another day!
.
S&P500 Index (SPX):
In my 10 Jan 2024 memo, ttiled 'What will 2024 bring?', I said the following:
'Make no mistake, the good news is that we now might have a date with SPX 5110 target in 2024. You see, using classical technical analysis, the Inverse Head & Shoulders pattern which has now been executed on 11 Dec 2023, points to a minimum target of SPX 5110.'
.
On 23 Feb 2024 (last Friday), SPX hit an intraday high of 5111, right smack at my target. Technically speaking, this 5110 Chart-pattern implied target is also the 2.00x projection of the Fibonacci levels (see Chart 1 below).

Chart 1 - S&P500 Index (SPX) dated 28 Feb 2024 (5110 target and 5111 SPX all time highs. Nope it's not a coincidence, it's 'confluence')
Now is SPX overbought? Absolutely.
.
Can it continue?
I must admit I wasn't expecting such a direct run towards my 2024 target in a span of two months!
.
But let me quote you this famous line from Mr John Maynard Keynes, a famed economist - 'Markets can remain irrational longer than you can remain solvent'. In any case, short-sellers or put option buyers are obviously not having a very good time..
.
Such is the exuberance of the US markets or rather, Nvidia & the AI narrative.
.
So what's next?
I'll be upfront here (again) with the good news. With the current momentum so strong and generally still concentrated in the mega-caps, I cannot rule out that Mr Market wants to reach for the 'stars'. And technically speaking, the 'stars' can be found at the 2.382% Fibonacci Extension Levels which actually translates to SPX 5300+/- (refer back Chart 1).
.
However, I'm personally biased for a garden-variety pullback to a more reasonable level, simply to relieve the overbought conditions.
.
Technical evidence for a pullback abounds:
.
Charts:
- Negative divergence are seen on multiple indicators such MACD, RSI, etc (See Chart 2 below)
- The excursion of price from its 200-day MA is at a percentage which usually signals a more potent pullback (See Chart 3 below, credit Thrasher Analytics)
.
Sentiment:
- CNN Fear & Greed Index is currently at extreme greed (78/100)
- Equities Put-call ratio is at that low point that usually signals a more potent pullback
- Recent Schwab Survey states clearly 'Bullish Sentiment Surges Among Retail Traders' (https://pressroom.aboutschwab.com/press-releases/press-release/2024/Schwab-Survey-Bullish-Sentiment-Surges-Among-Retail-Traders/default.aspx)
- Even professional money managers' behavior are signaling a top (See NAIIM - https://www.naaim.org/programs/naaim-exposure-index)
.
Other factors:
- Earnings reporting season is more or less over and Mr Market is likely to refocus back on the economy, CPI, NFP, etc, and economic numbers are likely less friendly than earnings reported.

Chart 2 - S&P500 Index (SPX) dated 28 Feb 2024 with negative divergences abound
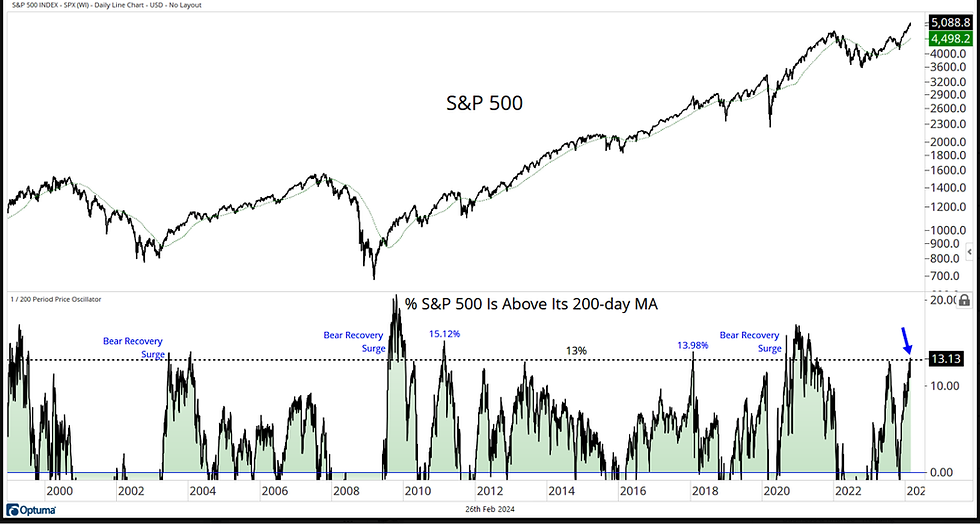
Chart 3 - Excursion of SPX price from its 200-day MA is at a percentage which usually signals a more potent pullback. Credit Thrasher Analytics
As you can see from the above, most of the arguments are at the 'sentiment' level. While sentiment is important, it more often than not reflects a condition rather than an actual signal to buy or sell. IMHO, the 'correct' signal to act should be found on price action. And for that matter, price action should start breaking some supports 1st, for a start.
.
A good place to begin is for price to break authoritatively the blue uptrend line that has been holding this steep rally since Oct 2023. Next will be the psychological round number of SPX 5000.
.
Last but not least, an optimal tool to assess where the reversal may be beginning is to use my Bollinger Bands (BB) strategy, i.e. price needs to do a sustained break below the BB bold red midpoint line and all bounces should be held back by this same midpoint line.
.
.
So in Layman's terms:
1. The good news is that the current price momentum may support a continued rally to 5300 SPX, being the 2.38% Fibonacci extension.
2. The bad news is the chart is overbought and is needing a decent pullback to relive the overbought condition.
3. For the pullback to kick off, price action should start breaking some supports 1st as well as the key psychological level at SPX 5000.
4. My bias & preference is for a pullback to start as we enter March, but Mr Market does not give a hoot to how I think.
5. In the meantime, another asset class is rallying hard now and that is the Crypto Complex. With Bitcoin ETFs launched in early Jan, there is indeed now a fuss-free way to participate** without fear of being defrauded or being hacked at the Exchange level. For more info, pls drop me a line.
.
**Warning Message from the authorities - Bitcoin ETFs have been likely identified as Payment Token Derivative (“PTD”). Trading in PTDs carries a high level of risk due to its exposure to the underlying payment tokens, including high price volatility, lack of price transparency, cyber security risks and the unregulated status of the product. The risk of loss from trading PTDs can be substantial.
.
Interesting times, no less! Let's watch this space!
.
As usual, Live Long & Trade Well.
.
Thank you & regards
.
Thomas Ng, CMT
Principal Trading Representative
首席股票经纪
.
#plsreaddisclaimer #chartforillustrationonly #spx28feb24 #BTC28feb24 #showmethechart #tellyouthenews #befluid #wytant #livelongandtradewell
Chart source: Tradingview / Thrasher Analytics'


Comments