The US Literally Just Added Oil to the Fire - Thomas ng 19 March 2026
- whatsyourtradingangle

- Mar 23
- 6 min read

On Monday, March 19 at 11.01pm, I emailed Clients my latest market update titled "The US Literally Just Added Oil to the Fire", offering key insights on the S&P 500 (aka SPX) - the world's most important index - and more.
Below is the full transcript for your perusal:
'Dear Clients,
Apologies for the slightly delayed memo. The past two weeks have been particularly busy, with developments in the Middle East impacting multiple asset classes simultaneously - equities, bonds, precious metals, crude oil, and the USD.
As I currently oversee multiple portfolios and client segments across stockbroking, wealth advisory, and Phillip Tai Seng Investor Centre, time has been stretched. I also apologise if I have not been able to get back to some of you as promptly as I would have liked. Securing a capable dealing assistant has also proven more challenging than expected, given the need for both the relevant licences and experience.
With that, let us get straight into the market.
The US Literally Just Added Oil to the Fire
The Lunar Year of the Fire Horse is certainly living up to its name.
In markets, the phrase “adding fuel to the fire” is often used metaphorically. In the current macro environment, however, President Trump has quite literally done just that.
The Fire Beneath the Surface
The “fire” refers to a triad of pressures already weighing on the US economy, even before the latest geopolitical escalation:
1. Weakening Economic Momentum
Recent data has been underwhelming. US job creation has turned negative, Q4 GDP came in at a soft 0.7% annualised, and consumer sentiment has deteriorated meaningfully. These are not characteristics of a resilient expansion.
2. Structural Labour Disruption from AI
Over the past year, I have consistently highlighted the risk that Artificial Intelligence is beginning to displace segments of white-collar employment.
This view is now increasingly mainstream. The Citrine Report in February 2026 echoed my concerns. In addition, AI is increasingly cannibalising the SaaS ecosystem and traditional service layers. AI-driven productivity gains may simultaneously reduce labour demand, ultimately feeding into weaker consumption.
3. Consumption Risk in a Demand-Driven Economy
This is critical because the US economy is fundamentally consumption-led, accounting for roughly 70% of GDP. A combination of slowing growth and AI-driven job displacement directly threatens the single most important pillar of US economic expansion.
Now Comes the Fourth Variable: Oil
Against this already fragile backdrop, the latest geopolitical developments have introduced a fourth destabilising force - crude oil.
Oil as a Universal Tax
Energy sits at the core of the global economy. When oil prices spike, it behaves like a tax on everything:
Transport costs rise
Manufacturing input costs rise
Logistics costs rise
These costs inevitably get passed down to consumers, eroding purchasing power.
With crude prices surging above $100 per barrel amid disruptions around the Strait of Hormuz, the world is facing a supply shock that could materially dampen consumption if sustained.
Historically, oil shocks are not dangerous because they are sudden, they are dangerous when they persist.
A short spike is manageable. A prolonged one forces markets to confront a far more uncomfortable outcome: a Global Recession scenario.

What I Shared with Clients Last Week
Some clients who checked in with me early last week would recall that I leaned cautiously constructive in the near term, despite the escalation.
As I mentioned to a client on 9 March 2026, Monday (see attached whatsapp note):
“as mentioned last week, if oil prices (WTI) spike above $80, it usually signals more market stress. Over just 1 weekend, WTI has jumped past $80 and is now trading around $101. Singapore and global stock markets got hit accordingly. On average, (US-led) geopolitical outbreaks take around 2–3 weeks to resolve. If it stretches beyond that, markets start to assess whether the shock could trigger a recession. My view is that with the US mid-term elections at the end of 2026, I don’t expect Trump to let this drag on too long - though the situation on Iran’s side remains a wild card. If you’re comfortable with this tactical outlook, it may be a good opportunity to start slowly accumulating shares in the local banks, with all three going ex-dividend across April.”
The key takeaway remains unchanged:
It is not the shock, but the duration, that matters.
Positioning in the Meantime
Year-to-date, the S&P 500 is down approximately 5%, reflecting the market’s repricing of risk.
For the sharp-eyed investors, you would have noticed that since October 2025, the index has largely traded sideways within a roughly 450-point range. In other words, markets have been meandering for some time, and the recent pullback is more a continuation of that range rather than a structural breakdown - at least for now.
In hindsight, the decision to pare down US equity exposure since September has proven to be a prudent one. By reallocating a portion of capital into the Phillip USD Money Market Fund, clients were able to adopt a more defensive stance - preserving liquidity while still earning an approximate yield of 3.2% p.a. over the period.
More importantly, this was achieved with significantly lower volatility, at a time when US equities traded sideways and experienced intermittent drawdowns.
In uncertain market conditions, the ability to stay liquid, earn carry, and reduce drawdowns remains a key part of portfolio construction.
Technical Picture - A Healthy Reset?
From a technical standpoint, the current pullback is not unusual following the strong rally over the past year.
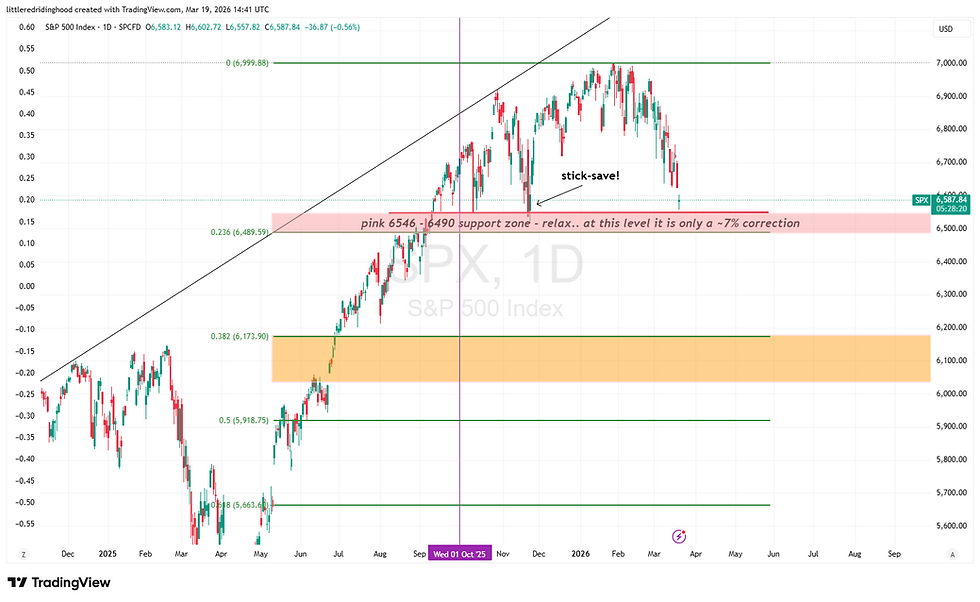
The S&P 500 is likely to test the 6,546 - 6,490 pink zone (note the slight adjustment following the new all-time high in February 2026), where multiple factors converge (See attached S&P500 chart):
6,546 - previously flagged in my 24 Nov 2025 memo as a key support level
6,490 - sits within the broader Fibonacci Retracement range and near-term support cluster
This zone is also likely to coincide with RSI approaching oversold territory
Taken together, this suggests the market may be approaching a technical stabilisation zone, assuming macro conditions do not deteriorate further.
That said, a sustained break below this range would likely open up the 6,174 - 6,035 orange zone, which represents the next meaningful downside support band.
What About Bonds?
Currently, the only two asset classes trending up clearly are crude oil and the USD.
For bonds, the situation is more nuanced, driven by two opposing forces:
Inflationary Pressures (Negative for Bonds)
Higher oil prices feed into inflation. This pressures the Federal Reserve to remain cautious or cut rates at a slower pace. As a result, yields may move higher, leading to near-term pressure on bond prices.
Economic Growth Slowdown (Positive for Bonds)
At the same time, weak jobs data and softer PMI readings suggest the US economy is slowing. High oil prices act as a consumption tax, further dampening demand. This increases the likelihood of future rate cuts, which would eventually support bond prices as yields decline.
This is why the Federal Reserve is effectively stuck between a rock and a hard place.
PIMCO’s Perspective - Why This Cycle Is Different
Recent views from PIMCO Asset Management offer an important counterbalance:
Less upside risk to yields
The US 10Y yield is already around 4.2%, a relatively restrictive level. Unlike 2022, there is less room for yields to move materially higher.
Energy-driven inflation may be contained
Based on PIMCO’s estimates, a sustained 20% rise in energy prices may add around 1% to CPI - meaningful, but not indicative of runaway inflation.
Limited fiscal stimulus
Governments today have less room to stimulate demand, which naturally caps inflation pressures.
The implication is important: while bonds may experience short-term NAV volatility, the broader inflation shock may be more contained than feared.
For clients who wish to review the full note, please feel free to drop me a message.

How to Think About Your Curated Bond Portfolio
For investors holding bond funds, including our flagship curated Bond Portfolio, it is important to keep perspective:
Bonds remain lower volatility instruments compared to equities
Some NAV fluctuations are normal, especially in periods of macro uncertainty
The key objective remains the delivery of stable and consistent income distributions
In essence, allow the opposing forces - inflation and growth slowdown, to work themselves out over time.
If recession risks eventually materialise, equities could correct 20 - 30%, while bonds may benefit from rate cuts and declining yields. This creates a natural portfolio balancing effect.
Final Thoughts
We are now dealing with a convergence of risks:
Weakening economic data
Structural labour disruption from AI
Fragile consumer sentiment
And now, a sharp oil price shock
The US economy already had a fire burning beneath the surface.
The latest geopolitical developments have simply added oil to it.
Whether this becomes a short-lived flare-up or a more sustained downturn will depend largely on how quickly geopolitical tensions ease and energy markets stabilise.
Instead of reacting to every headline from the Middle East, a simpler approach is to watch crude prices:
WTI below 90 suggests easing tensions
WTI above 100 suggests continued stress and potential downside
Please click here for WTI live prices: https://www.investing.com/commodities/crude-oil
As usual, Live Long & Trade Well!
Thank you & regards,
Thomas Ng, CMT
Principal Trading Representative
首席股票经纪
Chart source: Tradingview'


Comments