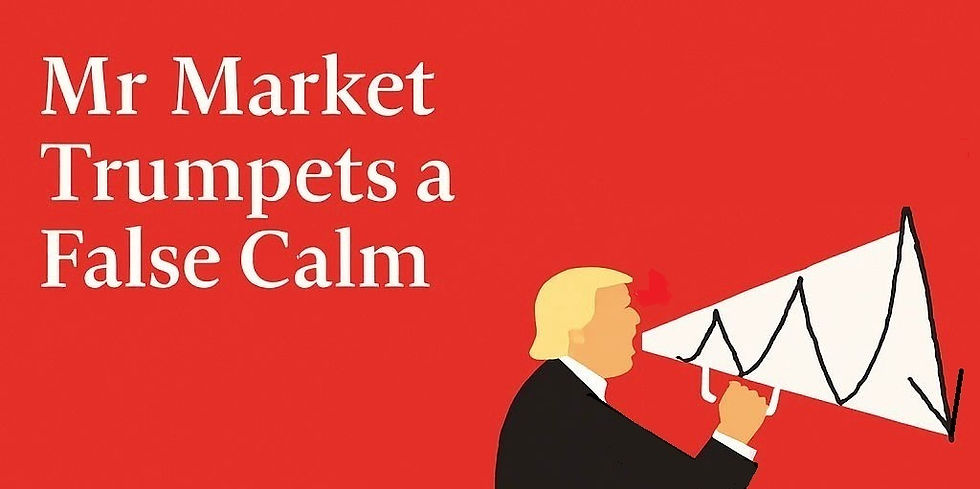
Mr Market Trumpets a False Calm - Thomas Ng 17 Aug 2025
- whatsyourtradingangle

- Aug 22, 2025
- 6 min read

On Sunday, August 17 at 8.12pm, I emailed Clients my latest market update titled "Mr Market Trumpets a False Calm", offering key insights on the S&P 500 (aka SPX) - the world's most important index - and more.
Below is the full transcript for your perusal:
'Dear Clients,
Today’s memo is perhaps one of the most important pieces of work I have produced in some time. I ask for your patience, as this will be a longer and more technical read — but one that I believe is critical for your portfolio decisions ahead.
The Broadening Pattern – A Rare Bearish Signal
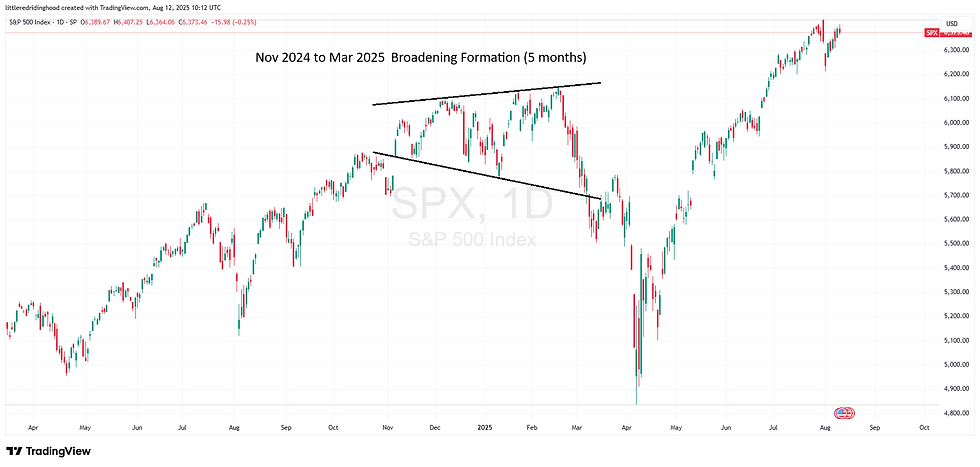
Let me begin by showing you a chart of the S&P 500 Index from November 2024 to March 2025 (see Chart 1 below), which displays a rare but noteworthy technical formation: the bearish Broadening Formation — also known as the “Megaphone” or “Trumpet” pattern.
According to Investopedia, a Broadening Formation is characterized by two diverging trendlines — one rising, one falling — with price swings becoming progressively wider. It typically occurs after a substantial rise or fall, and is identified by a series of higher pivot highs and lower pivot lows.
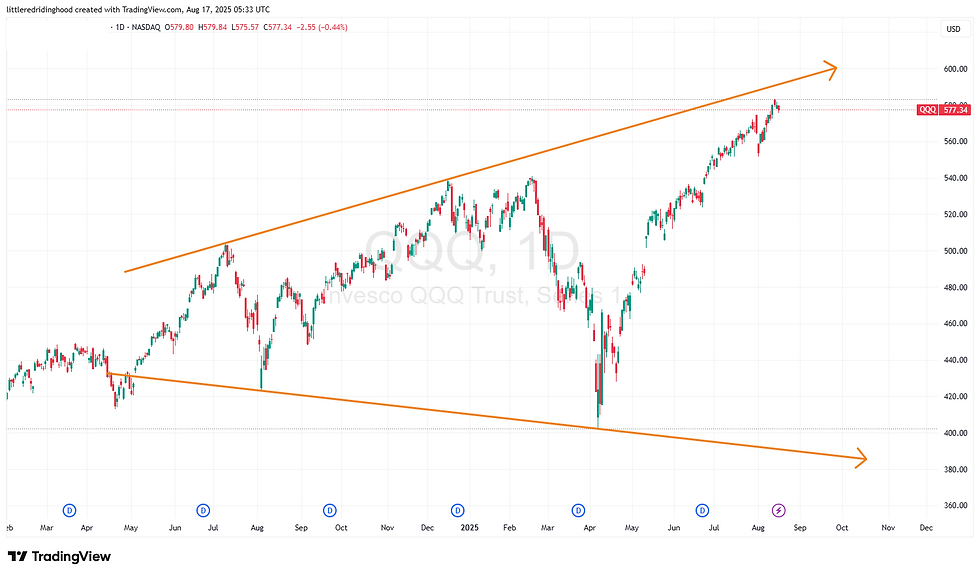
In a strong and long-lasting uptrend, this pattern often resolves with a significant drawdown once it completes. See Chart 1a & 1b for other examples.

Chart 1 - SPX Broadening Formation from November 2024 to March 2025

Chart 1a

Chart 1b
A Look Back – My May 2019 Warning
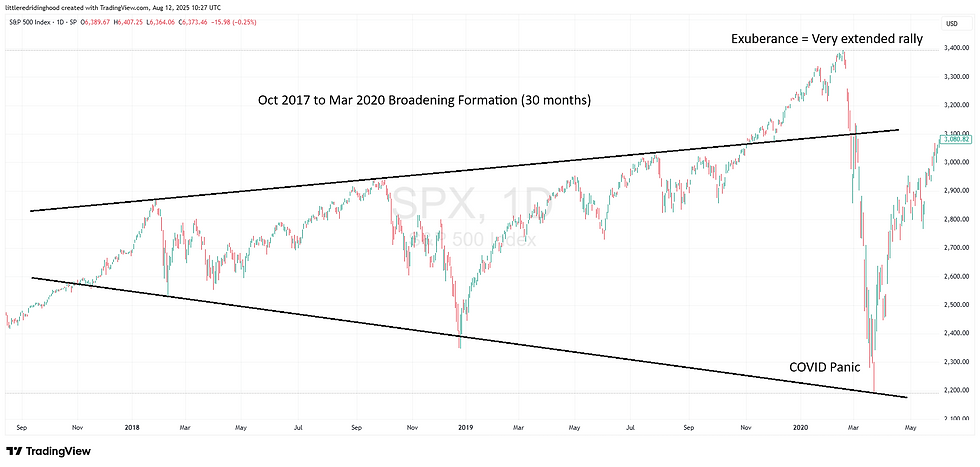
This is not the first time I have raised the alarm over this pattern. In May 2019, I wrote a memo to clients warning of a similar setup in the S&P 500 that had been forming from September 2017 to early 2019 (see Chart 2 below).
At the time, I quoted from the classic technical analysis textbook 'Technical Analysis of Stock Trends (1st ed., 1948)': "The Broadening Formation may be said to suggest a market lacking intelligent sponsorship and out of control — a situation, usually, in which the ‘public’ is excitedly committed and which is being whipped around by wild rumours… These formations tend to appear only in the final phases of a long bull market.”
Back then, the market continued to rise and even broke above the upper trendline of the Broadening Formation in late 2019. This breakout led some clients to doubt whether my analysis was correct.
What happened next is now history: by March 2020, the S&P 500 had fallen 35% in a swift collapse triggered by the COVID-19 pandemic.
Did I know COVID was coming? Of course not — and it did not matter. The chart pattern had already given advance warning. In other words, the trigger may have been unforeseeable, but the risk was visible. In hindsight, the Broadening Formation proved correct.
You may read my May 2019 memo here: https://tinyurl.com/nothingnewundersun
The question now: Will I be proven correct again?

Chart 2 - SPX Broadening Formation from September 2017 to early 2019
The 2024–2025 Setup – History Rhyming?
Fast forward to today. The current S&P 500 chart shows two overlapping Broadening Patterns:
A smaller one forming between November 2024 and March 2025 (5 months), as per Chart 1 above
A larger one from Jun 2024 to present (14 months), see Chart 3 below
Remarkably, both of these — and the 2017–2020 pattern — share a unique coincidence: they emerged when Donald Trump was either in power or coming into power.
Investopedia notes that such formations often arise during periods of heightened political risk, particularly ahead of elections. Divergent polling, unpredictable policy announcements, and sudden swings in sentiment can cause markets to lurch between extremes. Under Trump’s presidency and campaign periods, these dynamics have been especially pronounced:
Sharp swings between extreme optimism and pessimism driven by speeches, policies, or posts on X (formerly Twitter).
Record retail participation in equities, meme stocks, and zero-dated options, amplifying volatility.
“Smart money” hesitation — evidenced by the lack of buying support at lower trendline tests.
In a typical uptrend, Smart Money steps in at trendline support because they perceive 'value' there. The widening lower lows of the Broadening Formation tell us that even institutional investors may not fully grasp or trust the “playing field” — hence, lacking intelligent sponsorship.
Now, even if I am wrong about the Broadening Formation, the S&P500’s steep rally from April’s tariff-panic lows — in just four months — is extremely stretched without a meaningful pullback.
A garden-variety correction of 8%–15% would still be reasonable.

Chart 3 - SPX Broadening Formation from Jun 2024 to present
Why I’m Staying Defensive
Beyond the pattern itself, other market and macro indicators reinforce my cautious stance:
Technical:
Negative Seasonality ahead — As I've mentioned the concept of Seasonality many times in my memos, September and October are historically the weakest months for US equities.
4-year US Presidential Cycle — Historically, the first two years of a new presidential term tend to be soft.
Valuation:
Buffett’s market cap-to-GDP ratio at extreme levels — Buffett once called this “playing with fire” at 140%; today it sits near 200%.
Record cash relative to assets at Berkshire — as I have said before, the Oracle may never tell you to sell, but watch his actions, not his words.
Shiller’s CAPE ratio near historical highs.
Sentiment:
Record net US corporate insider selling - See Chart 4

Chart 4 - US C-suites folks are sellling.. hard
Economic:
July non-farm payrolls were glaringly weak; June and May payrolls were revised sharply lower, signalling underlying economic softness. This has been consistent with my views that US demand destruction is likely ongoing, as per expressed in my April 2025 investment memo. See Chart 5, 6 below and https://www.cnbc.com/2025/08/01/jobs-report-july-2025.html
EPS growth is still concentrated in a narrow group of mega-cap stocks. See Chart 7

Chart 5 - 3m average nonfarm payrolls reaching point of no return?

Chart 6 - Demand Destruction ongoing?

Chart 7 - The 490 Soldiers aren't following through with the 10 Generals?
Regulatory / Policy:
Trump’s unpredictable policy risks.
Market strength is likely already pricing in future Fed rate cuts and this may actually limit their actual impact on equities then but potentially benefiting bonds more.
My recommendations:
Reduce equity exposure to levels where you can “sleep well at night.”
Use the current rally in global stock markets to sell into strength.
Increase cash holdings.
Consider shifting to our flagship Bond Portfolio Solution - short to intermediate-term global bonds for capital preservation and yield.
Portfolio Implications
Given the alignment of the current pattern with previous high-risk setups — including my 2019 call that preceded a major market drawdown — I believe prudence is warranted.
As mentioned in my April 2025 memo, I am looking to reduce our PGGL Portfolio (Phillip Global Growth Leaders) equity exposure by another 25% and have been actively advising clients to boost their bond allocation.
If you are lightly invested — say, 20% of your portfolio — perhaps no urgent action may be required, as you have dry powder should my call be correct. But if you are 80%–100% in equities, I strongly suggest rebalancing.
Conclusion
To be clear, this remains a bull market. Short-term trading opportunities exist — just avoid holding positions with a long-term “buy and forget” mindset when the warning lights are flashing.
This is the third Broadening Pattern I have observed in the S&P 500 during a Trump presidential cycle. The previous one — during Trump 1.0 — ended with a 35% drawdown. Whether the trigger is obvious today or not, the risk structure is flashing red.
This is not a call for panic, but for prudence. The next few months may test investor discipline, and maintaining a defensive stance now can preserve both capital and peace of mind. In investing, avoiding deep drawdowns is as important as capturing upside — and the present environment calls for exactly that discipline.
Reducing equity exposure now is about positioning yourself near the proverbial exit when someone yells “Fire!” in an extremely crowded theatre.
Now, will I be proven correct again? Time will tell. But I will always prefer to prepare rather than predict.
Oh, and one more thing - Charts 1a and 1b are not ancient examples — they are the current Nasdaq 100 ETF & Nvidia price charts, respectively.
So sit back, enjoy the show — but always keep one eye on that EXIT sign!
Live Long & Trade Well.
Thomas Ng, CMT Principal Trading Representative 首席股票经纪 www.thom-ng.com #plsreaddisclaimer #chartforillustrationonly #spx17aug25 #whatsyourtradingangleChart source: Tradingview'


Comments